The Manager Module
The Manager module is presented in this section and look like the following, the first time you open it following the instructions.
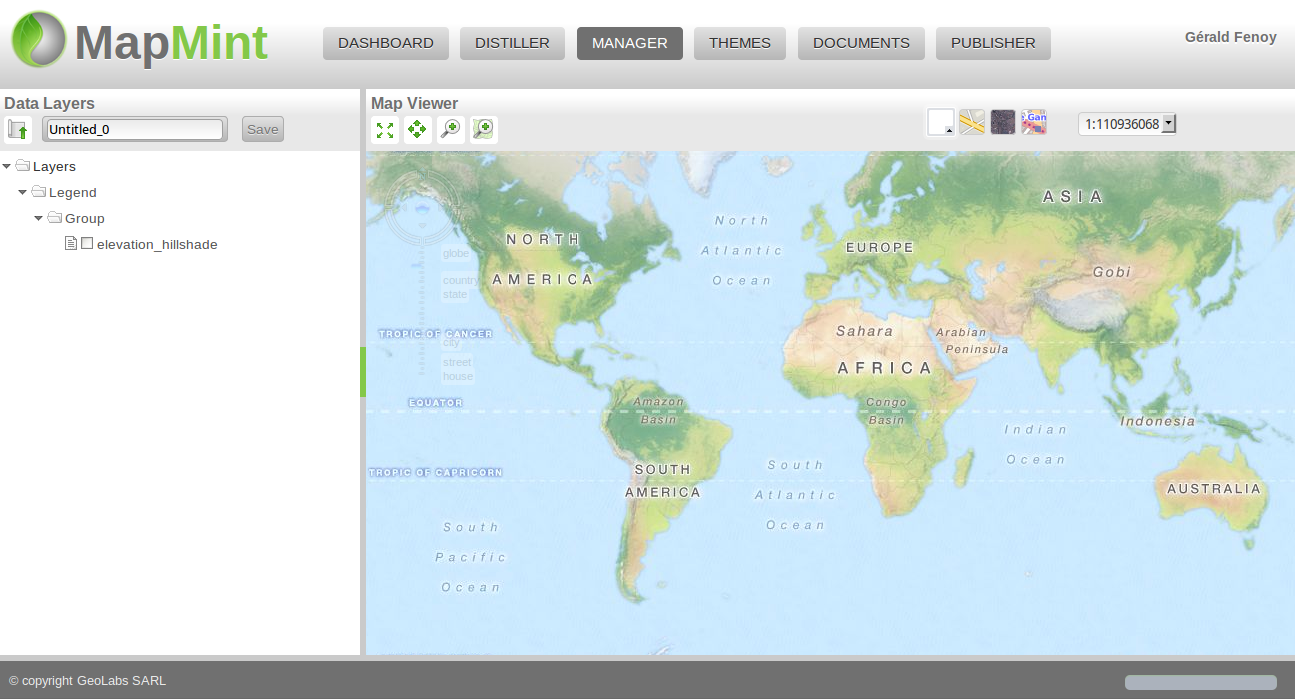
The Data Layers pannel
- The Data Layers pannel is the left side pannel and contains two elements:
A map gesture toolbar
A tree presenting your layers list
Note
For each MapMint map there is a configuration file which is a MapServer mapfile
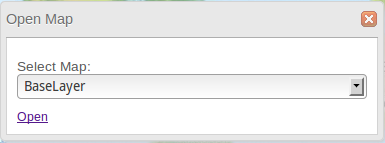
Open a Map
To open an existing map, simply click on the button presented below and the Open Map window presented below to let you choose one amongst the listed ones.
Icon |
Action |
|
Open an existing map |

From this window, if you click on the Open button, your Manager will be reloaded using the choosen map.
Save a map
To save your current map, you should click on the Save button in the toolbar. You can use the text field to save your map using a different name.

Warning
The map name should not contain any space, accent or any special character
You are now invited to name your map Sample1, then save it. Your Manager mondule will be reloaded and display the map name you just set.
Warning
Each time you open a map using the Open in Manager button as you did previously, the first step is to save your map with a correct name. The Untitled_0 is the default temporary name given each time an adminstrator is opening a layer in the Manager from the Distiller module.
Layers tree
If you right click on the root node of the layers tree (the Layer item), a contextual menu appear and offer the following capabilities.
Icon |
Action |
|
Add a Layer to the tree |
|
Add a layer group to the tree |
|
Set layer order |
|
Add a GRID layer to the map |


If you right click on a layer, you wil then get access to the following tools:
Icône |
Action |
|
Zoom to the data source extent |
|
Open the attributes tables |
|
Open the Styler windows to define the style for your data |
|
Open the Properties window |
|
Open the template editor |
|
Open the submenu to set maximum / minimum scale to display your data |
|
Open the window for deleting the layer from the current map |
|
Activate the capability to move a layer by drag’n drop in the tree |


Map viewer
The Map viewer is the right pannel where the map and potentially your layer, if any is activated. On top of the map you have, a toolbar on the left, which we call the navigation toolbar and which contains the following buttons.
Icon |
Action |
|
Activate the pan control to let you move the map |
|
Draw a rectangle and zoom to the corresponding extent |
|
Zoom to the max extent |
|
Draw a rectangle and import points or lines from OSM, add the layer to the current map |

You can choose which base layers you want to use by using the toolbar on the right side on top of the map.
Icon |
Action |
|
Use a unique color as base layer |
|
Use MapQuest Street as base layer |
|
Use MapQuest Satellite as base layer |
|
Use OpenStreetMap as base layer |


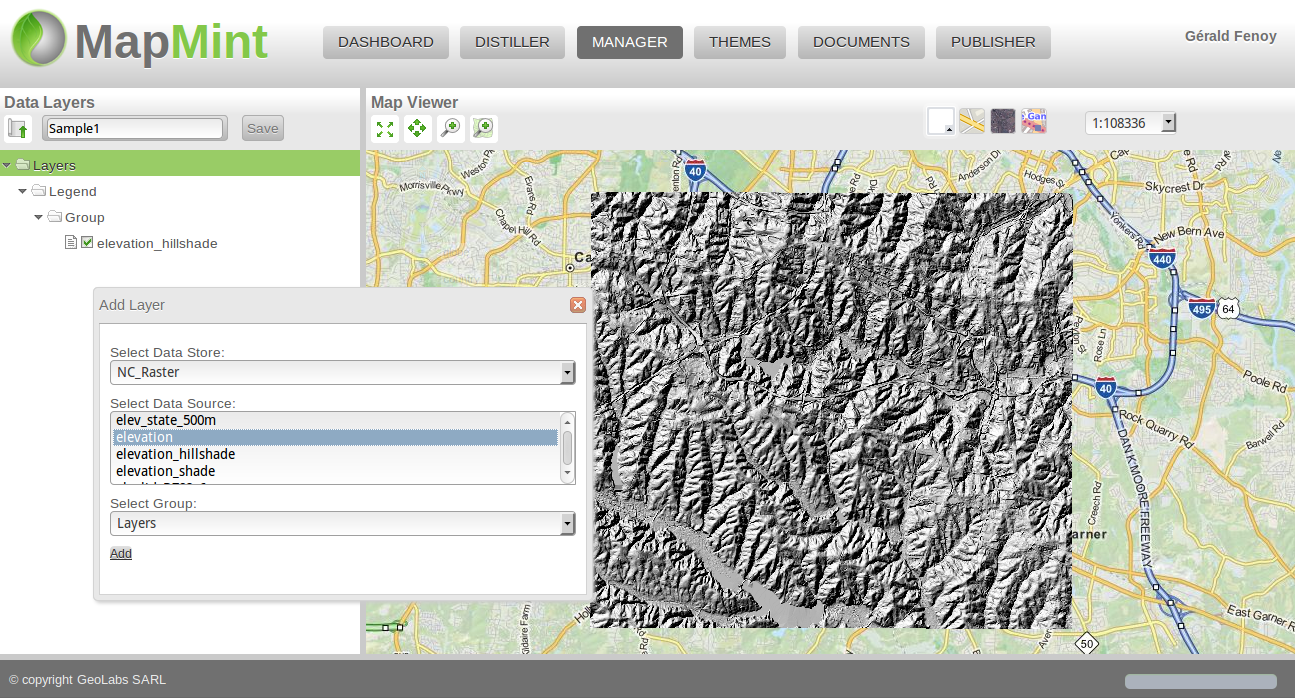
Add Layers
By pressing the button Add Layer, you have then a window like the one presented below which let you choose first the data store, then the list of layers available in it and to finish the place in the tree where you want your layer to be added.
Note
If a layer is added directly at the root level, so as a child of the root node (Layers), then it won’t be available in the layer switcher available in the correcponding published web application.
Your objective is to add the elevation data source you used to create elevation_shaded. So you will first select the NC_Raster, then the data sources liste will be refreshed and then you can select the elevation data source to add it as a new layer to your current map.
Now, you are invited to do the same procedure to add the following layers from the NC_Shapes data store:
lakes
roadsmajor
new_poi_wake
Note
You can use Ctrl + click to select multiple data sources to add them as individual layers to yoru current map.
Warning
If you keep the default value for the Group where your layer will be located, it will lead that this layer won’t be available in the layer switcher from the published application.
Defining Layer Styles
In this section you will learn how to define the style used to display your data in the final application.
Note
All modifications made to the layer style is automatically saved in the map configuration file, so there is no need for pressing the Save button in the Data Layers toolbar.
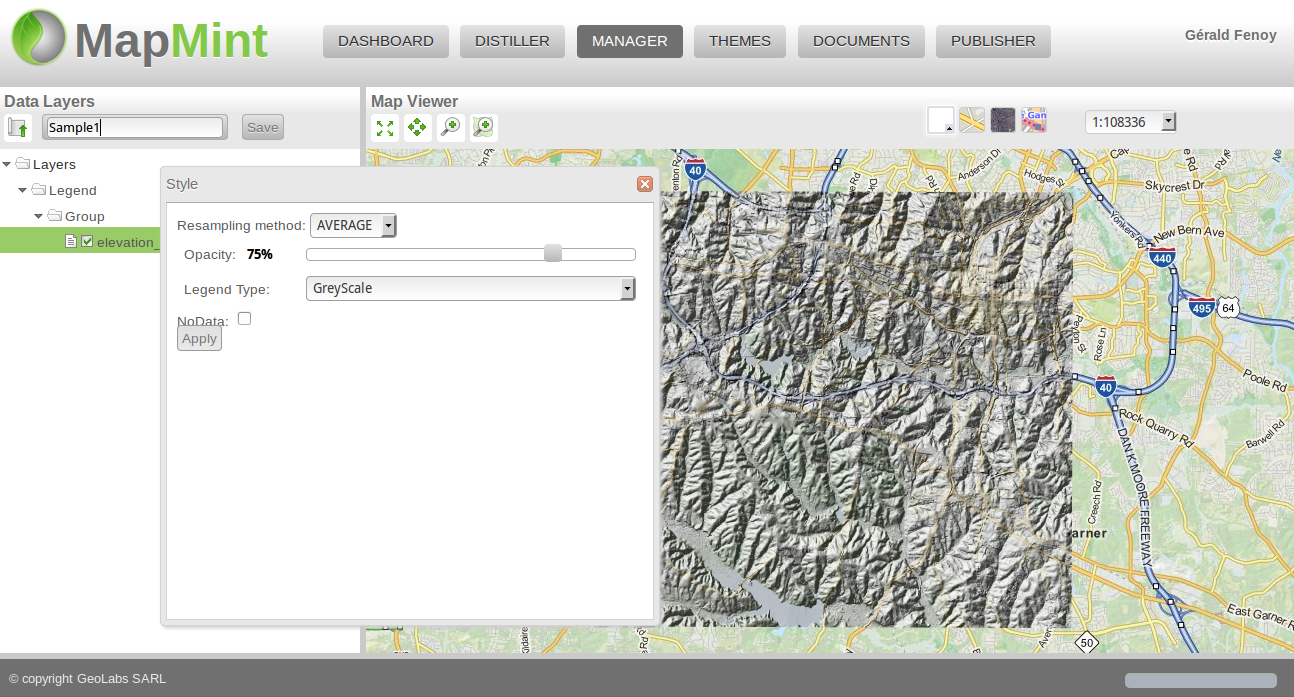
Basic raster style
You are invited to right click on the elevation_hillshade layer then click on the Style item to have a window giving you access to the basic settings for raster data:
Resampling method
Opacity
Legend Type
You will set resampling method to AVERAGE, opacity to 75% and keep the default value for Legend Type (GreyScale), then press the Apply button at the bottom of the form.
Classify raster layer
You are now invited to edit the style of the elevation layer of your map. Do as you did before, but set opacity to 50%.
Once you pressed the Apply button, you can now set the Legend Type value to Graduated Symbol, you will automatically see the form updated consequently as presented in the screenshot below.
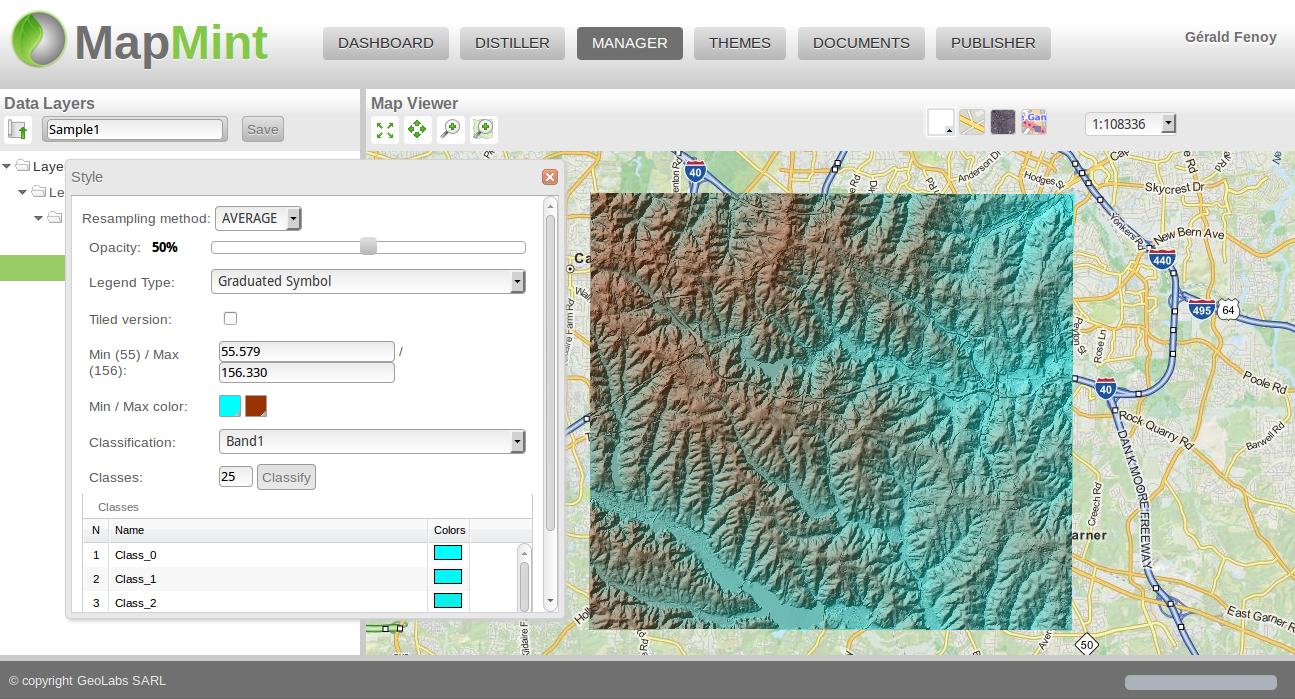
From this form, you can set minimum and maximum value to classify, define min and max color used to generate colors, the band used to classify and finally the number of classes.
By now, let’s start by choosing a minimum and maximum color, set number of classes to 25, then press Classify, you should have similar result as the one above.
Basic vector style
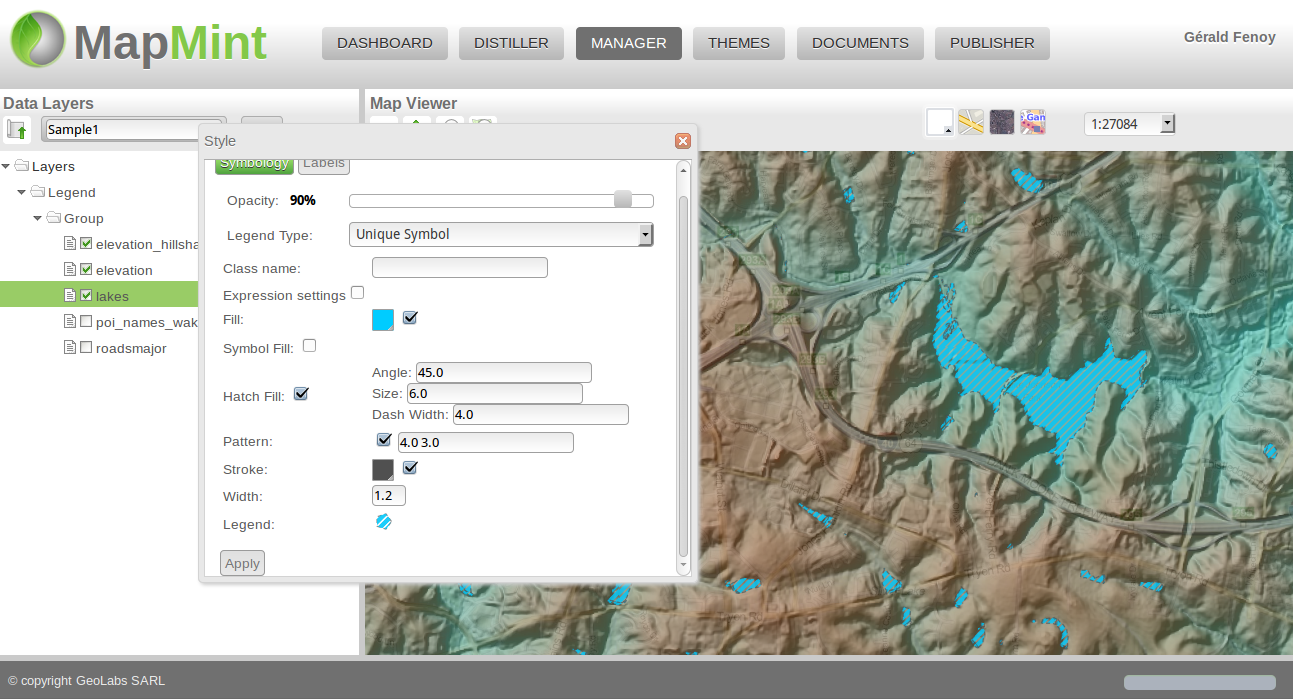
You will start by editing the style of the lakes layer, you will first check the Pattern pannel and set its value to 4.0 3.0, then press the Apply button. Now, check also the Hatch fill pannel and set the following values:
Angle: 45.0
Size: 6.0
Dash Width: 4.0
Click on the Apply button and you should have the same result as displayed below.
Classify a vector layer
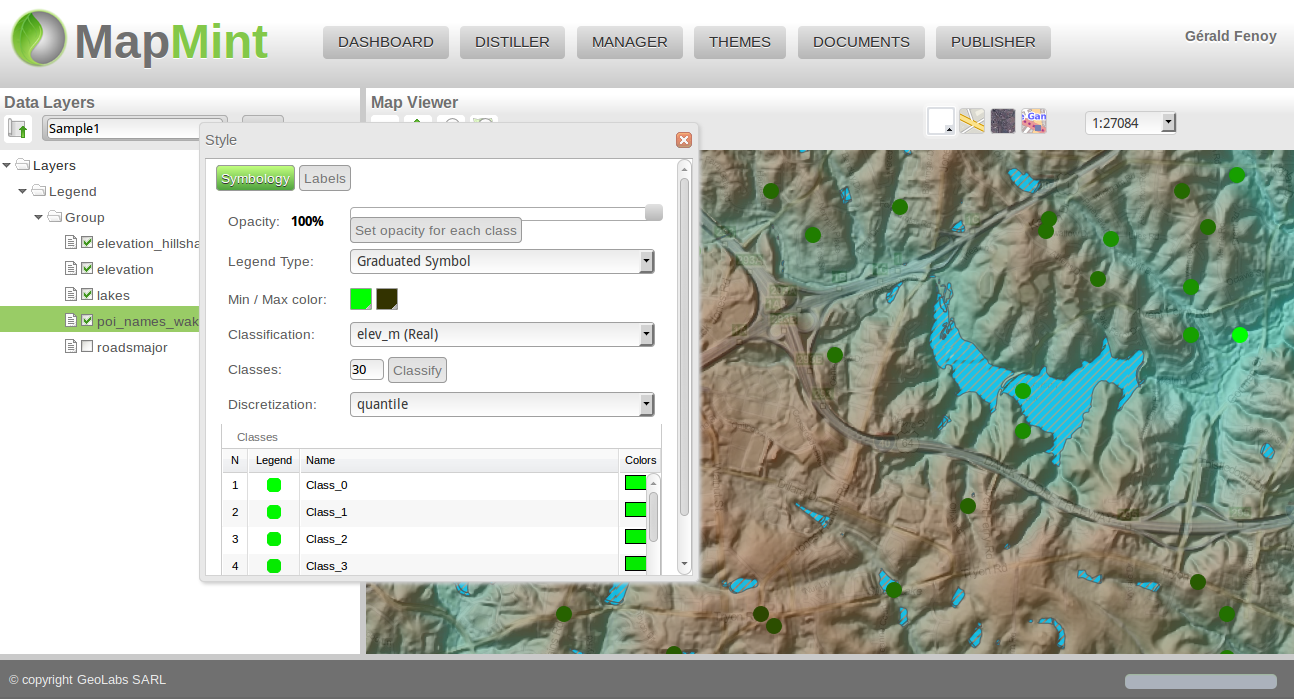
In this section you will create classes based on classification. Classifications presented in this section are using R, you will use the poi_name_wake layer to test this style definition.
Set the Legend Type to Graduated Symbol, choose min and max colors, choose the elev_m field to classify your data, set number of generated classes to 30 and set the discretisation method to quantile, then press the Classify button to have similar restul as presented below.
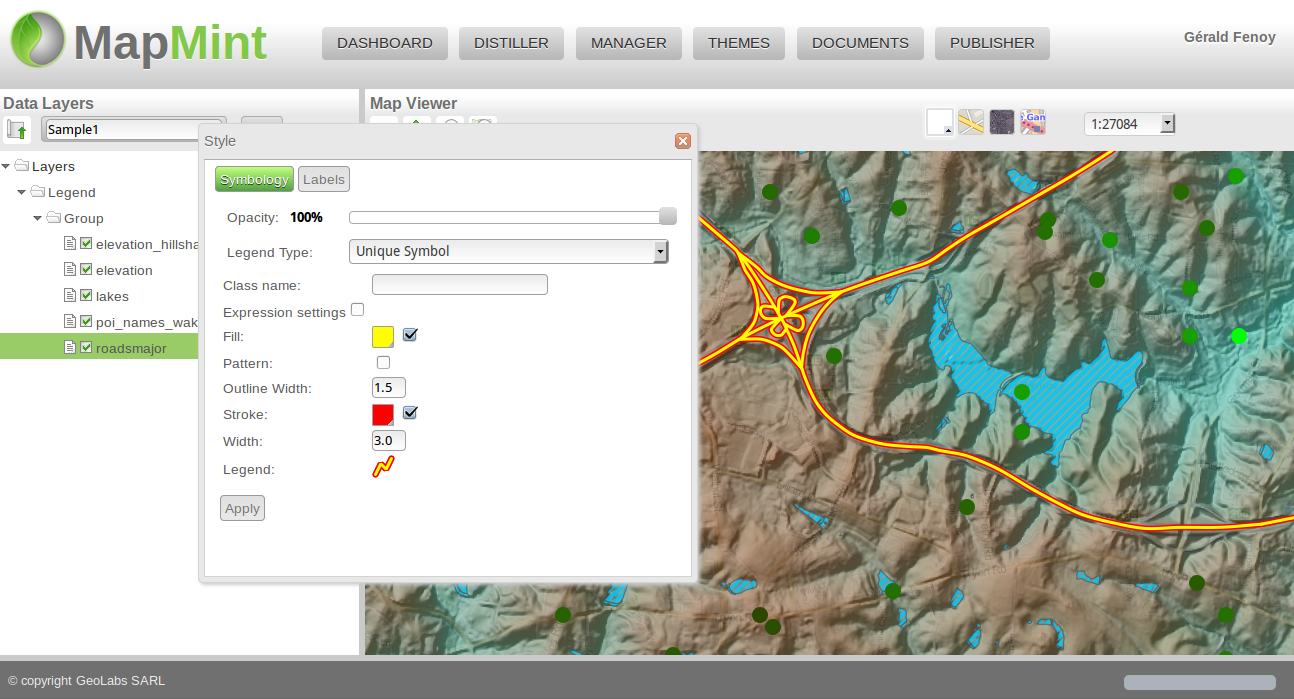
Before closing this section about Styling, you are invited to apply a style to your roadsmajor layer.
Layers properties
Metadata
For each layer in your map, you are invited to define metadata, by now you will concentrate on giving a title to your layer, then press the Save button.
Warning
Titles will be displayed in the layer tree of the published application only.
You can also define basic OWS Metadata informations for your layers, such as asbtract, keywords and fees. other options will be presented in the next sections.
The metadata can be accessed through a simple WMS GetCapabilities request sent to the MapServer engine, like the following:
http://localhost/cgi-bin/mapserv.cgi?map=/var/data/maps/Project_Sample1.map&service=WMS&version=1.0.0&request=GetCapabilities
Quaryable layers
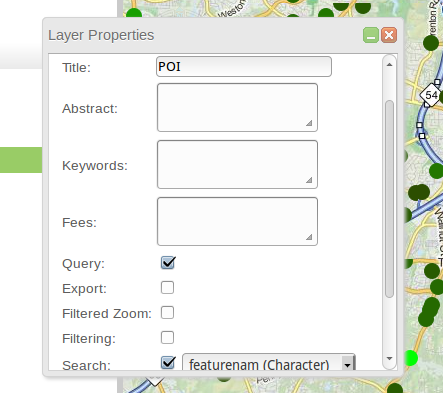
You would like to make the final application users able to display information in a popup when they move their mouse on top of a feature. To achieve this goal, you first have to declare in the layer’ properties window that you want your poi_names_wake queryable by checking the Query option. Then you should also create a template to display attributes in the popup, as explained in the next step.
You are also invited to check the Search option and select the featurenam field as field to run the research. This way you can activate more tools at the next step.
Every time you made a modification to the Layer Properties window you should press the Save button for your modification to take effect.
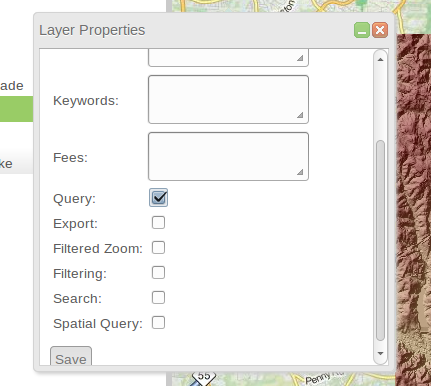
You are also willing to publish a web application with a tool to draw line and extract the corresponding elevation profile based on a specific raster. To do that, you should activate the Query option to the elevation layer.
Layer properties for new_poi_names_wake |
Layer properties for elevation |
|
|
Configure popup window
You are now invited to use the template editor for the new_poi_names_wake layer of your map. You can select fields you want to diaplay by selecting value in the Available fields, you can easily control the way it will be displayed by using WYSIWYG editor. Click on the Save button to save your template.
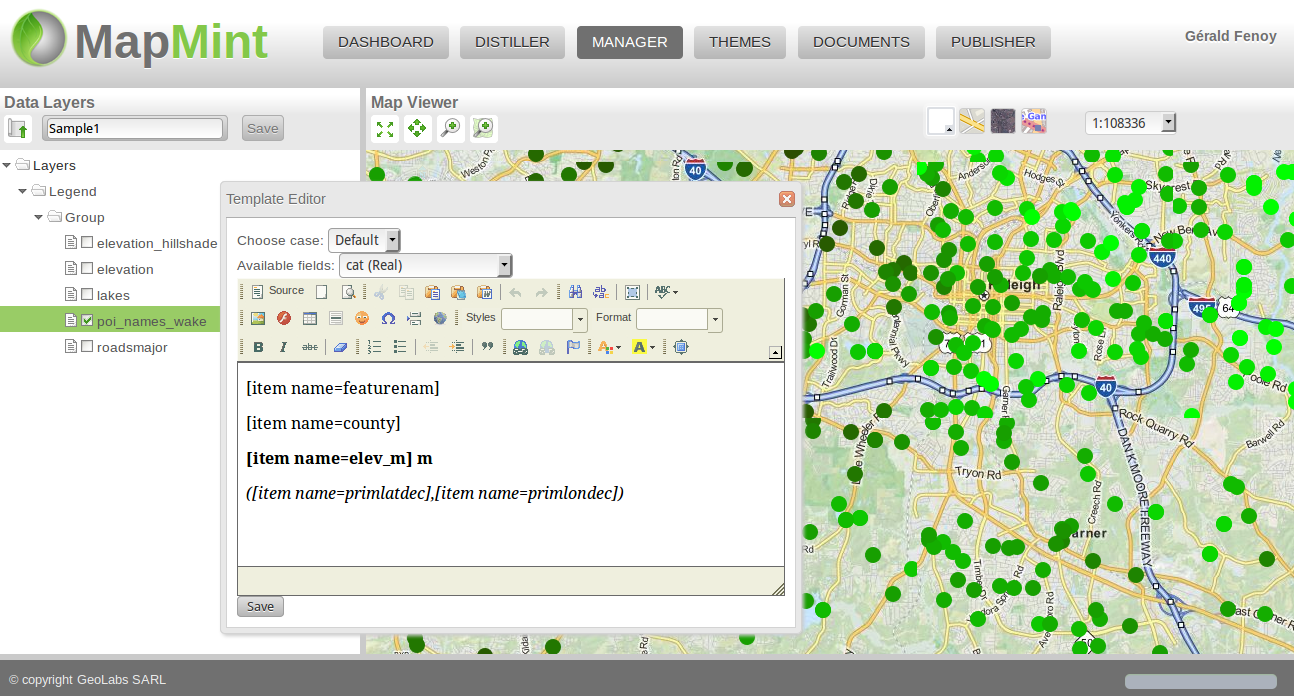
Note
If you need to, you can always edit pure HTML code by clicking on the Source button of the editor.