The Distiller module
Overview of the interface
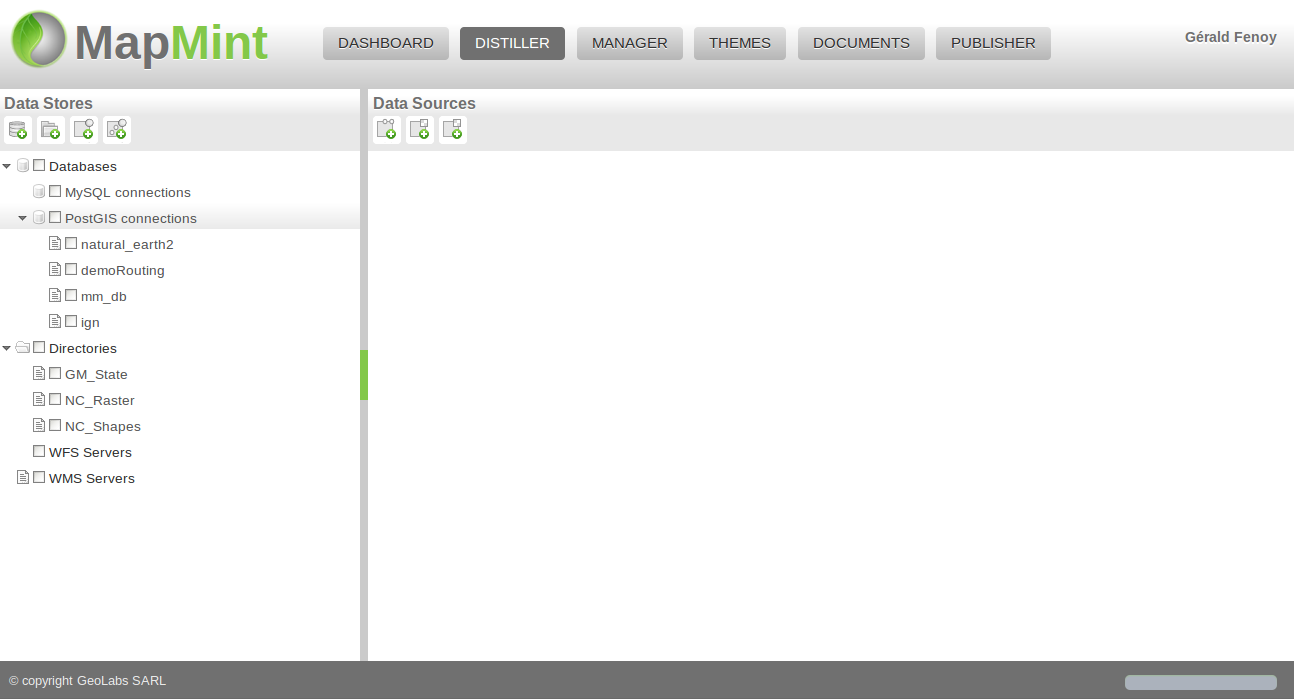
The Distiller Interface contains two pannels and looks like the following.
The Data Stores
A Datastore is containing data sources, it can be local or remote. It is defined by a unique name and various parameter depending on its type. By now, there is 4 differents datastore types supported in MapMint:
Icon |
Type |
Action |
|
DataBase |
Add a database connection |
|
Directory |
Add a server directory |
|
WFS Server |
Add a remote WFS server |
|
WMS Server |
Add a remote WMS server |


Warning
The datastore name should not contain any accent or any special charater available in any language
During this workshop, you will use the two datastore already available: NC_Raster and NC_Shapes.
Note
Afterward, you can always add your own data in /var/data/ftp/your-directory and then create a corresponding datastore from your Distiller.
If you check the checkbox on the left hand side (so in the Data Stores section), you will get a list of available datasources in this datastore displayed on the right hand side (so in the Data Sources section).
The Data Sources
A data source is corresponding to GIS data available in a datastore (it can be a table in a database, a shapefile in a directory, a layer in WFS/WMS layer). Various datasource types are supported by MapMint.
Icon |
Type |
|
Point datasource |
|
Line datasource |
|
Polygon datasource |
|
Raster datasource |
Data sources toolbar
Once listed, each data source available in a datastore have a toolbar associated which contain the following buttons.
Icon |
Action |
|
Define access permission |
SRS |
Define Spatial Reference System |
|
Converting the data source |
|
Download the data source |
|
Preview the data source |
|
Open the data store in the manage |
|
Delete the data source |
|
Display the data source (attributes table or histogram) |

Warning
When the SRS field contain No EPSG, it means that MapMint understand the SRS of the data source but cannot display it as EPSG code, only when (undefined) is displayed, the SRS is unknown. In such a case, MapMint will use EPSG:4326 definition as default SRS, but you can, at any time, click on this button to override this definition.
Quickly preview your data
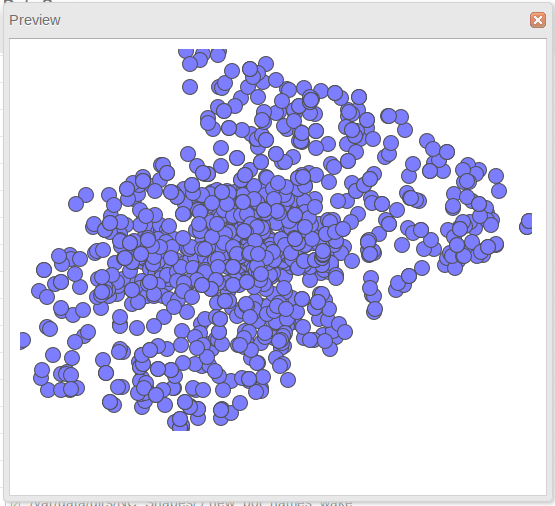
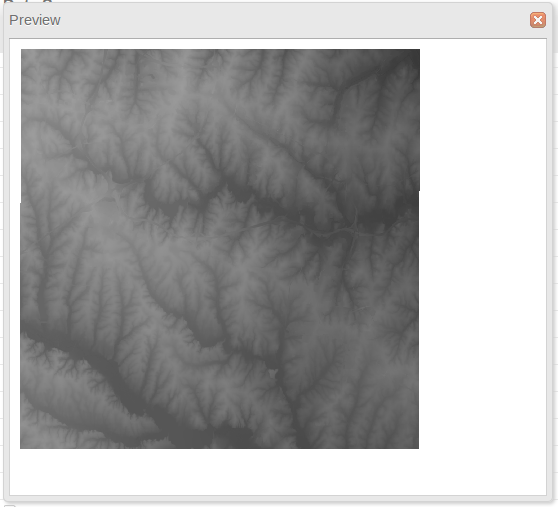
For both vector and raster data source, you can preview your data source by clicking on the Preview button, you will then get a window presenting the data using a GetMap WMS request and which should look like the following:
Vector data source |
Raster data source |
|
|
Vector data sources
You are invited to first display data sources available in the NC_Shapes data store.
Display attributes table
If your press the button looking like a down arrow (the last row of the toolbar table) you can display the attribute values table and browse your data smoothly, you can order and modify column order. One important capability of the table is that you can modify the encoding of your data in case you are using data not in UTF-8 encoding, this way your data will be returned correctly in utf-8 from your WFS server.
Note
Vector data source are always using a basic style you cannot have access to.
Convert vector data sources
You are invited to click on the Convert button in the toolbar for the poi_names_wake to acces the converting tool window as presented in the screenshot bellow.
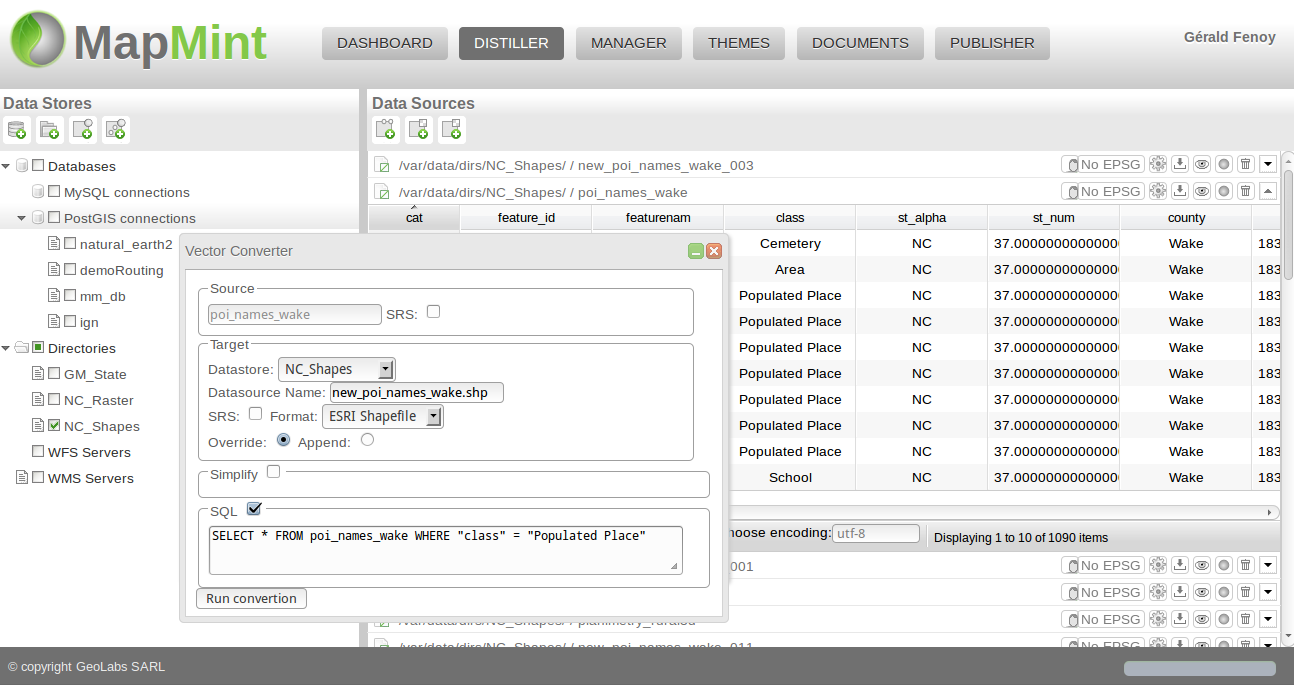
The Vector Converter window contains various parameters you can set to create a new data source by transforming the original one. There is 4 part in the form:
Source SRS: optional, to define the source Spatial Reference System (SRS) (should be onnly used in case there is written (undefined) in the SRS section in the data source toolbar.
- Target: to define:
Datastore: the data store where your data source will be created
Datasource name: the data source name which will be created
SRS: optional, the SRS used to create the new data source
Format: the data source format of your created data source
Simplify: optional, give you the capability to simply the data source geometries
SQL: optional, give you the capability to simply the data source geometries
Warning
in case the created data source is a file, make sure to add the extension in its name else it will lead to a directory creation making your data store unavailable. So you will have to remove the directory created in case you define wrongly the data source name. Then, to have up-to-date list, first right click on the Data Store unavailable and click on the Refresh item from the displayed contextual menu, then check it again.
We will use the following example: from the points of interrest data source, you would like to extract the subset containing only the Populated Places. So you will first check the SQL section and fill the textarea with the following query:
SELECT * FROM poi_names_wake WHERE "class" = "Populated Place"
Now, click on the Run convertion button, once your data source will be created, the window should be closed automatically, now you should refresh your data store, by accessing the contextual menu by right click on the NC_Shapes data store. Once the Distiller was reloaded, check your data store again and you should see appearing your new data source.
Note
The Source code of the ZOO-Service vector-converter is based on ogr2ogr from the GDAL library.
Raster data sources
You are invited to first display data sources available in the NC_Raster data store.
Display histogram
If your press the button looking like a down arrow (the last row of the toolbar table) you can display the histogram of your rasyer bands.
Raster tools
As you did previously for vector data, open the Converter window for the elevation data source.
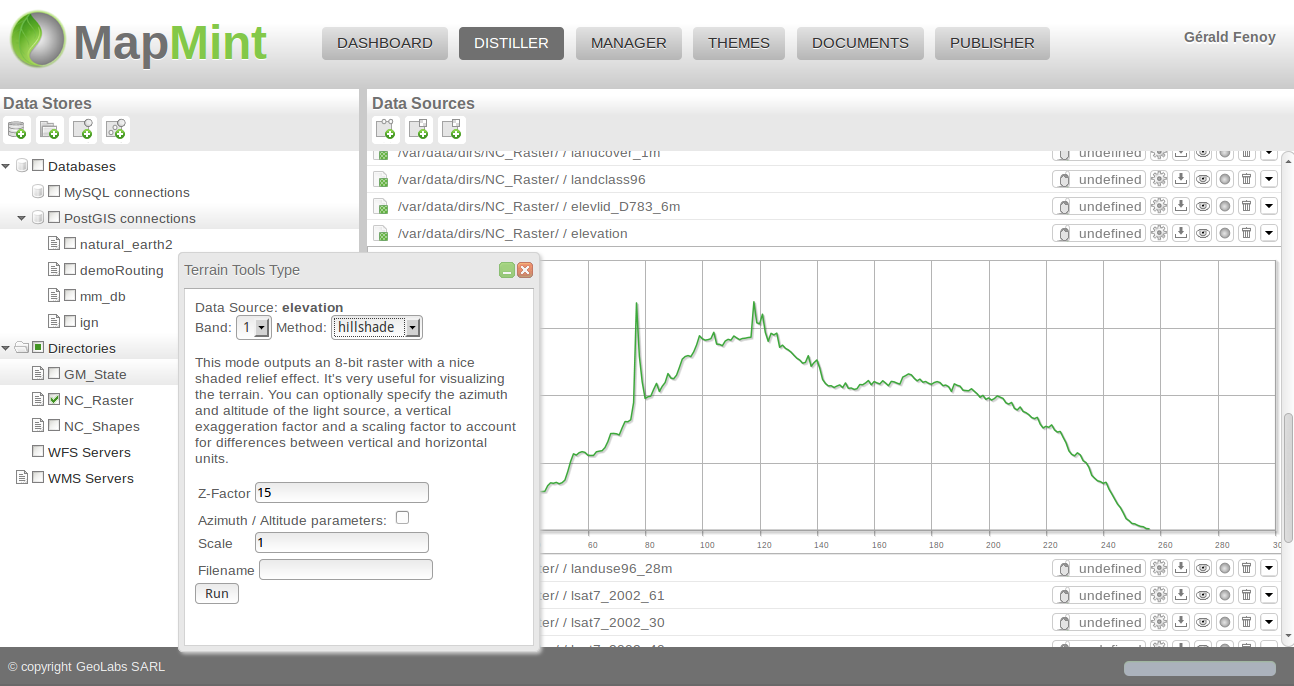
Your goal is to create a new raster data sources named elevation_shaded with a nice shaded relief effect. First select the hillshade method, then set the Filename value to test_elevation_shade then click on the Run button.
You are free to generate more raster data sources using other methods, please make sure to change the name any time you generate a new raster data source.
Now, you will simply need to refresh you data store as you did before. Once you have it listed, you can preview it.
Open a data source in the Manager
Using the raster data source created in the previosly, prior to go to the next section, please click the Open in the Manager button (6th row from the toolbar table) of the elevation_shaded data source.
Note
The raster convertion tools presented here are based on gdaldem dan gdal_contour source code from the GDAL library.