Use MapMint
Table of Contents
MapMint The application consists of an administration interface with various modules and a public interface.
Access to administrative modules
Depending on the settings of the Control Panel and your MapMint installation, the modules listed below are available in the administration interface.
| Module | URL access |
Dashboard |
http://votre-instance.com/Dashboard_bs |
Data Management |
http://votre-instance.com/Distiller_bs |
Creating territories |
http://votre-instance.com/Territories_bs |
Creating indicators |
http://votre-instance.com/Indexes_bs |
Creating themes |
http://votre-instance.com/Themes_bs |
Import documents |
http://votre-instance.com/Documents_bs |
Creating maps |
http://votre-instance.com/Manager_bs |
Publishing Applications |
http://votre-instance.com/Publisher_bs |
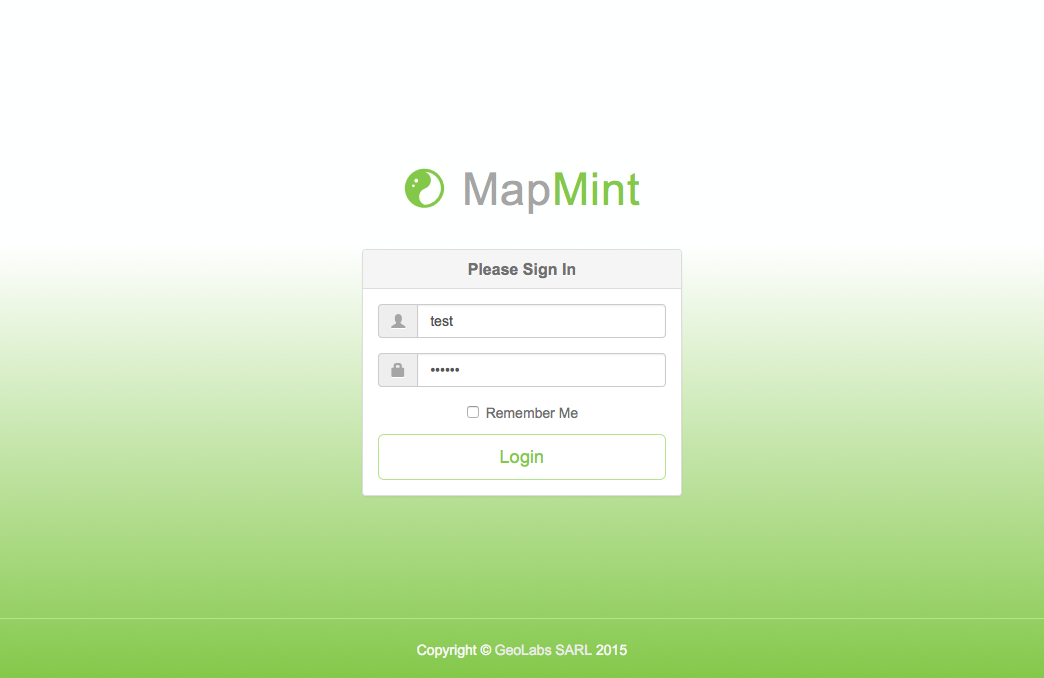
Identification Form
To view modules in the administration interface, enter the username and password that have been communicated to you by email in the login form shown below, and click the “Login” button.
Note
You can also press the “Enter” on your keyboard instead of clicking on the button “Identify”
A success message is displayed in a green frame on the top right of your screen and the module is charging. If you get a red banner at the top of the screen, please check your connection settings and try again.
Access to the public interface
The public interface of MapMint is accessible via the URL http://votre-instance.com/public/ which is the home page of the application. The published cards are accessed from the Map Library (second menu tab). One can access an specific card using are specific URL (such http://votre-instance.com/public/le-nom-de-votre-carte).
| Module | URL access |
Public interface |
http://votre-instance.com/public/ |
Public interface indicators |
http://votre-instance.com/public/indicateurs |
Published map |
http://votre-instance.com/public/le-nom-de-votre-carte |
First settings
During an initial connection, the following steps are recommended to ensure the proper functioning of the public interface.
Title of the public interface
The title of the public interface appears in the banner at the top of the home page. To configure it, go to the Control Panel and change the value Title on the tab Provider Configuration. Click the “Save” in the Control Panel and load your home page for the changes to take effect.
Note
The title is also used in the <title> tag of the source code of the page
Map of the public interface
The public interface card appears in the body of the home page. To create and configure, go to the Map creation module and create a project named Default. Once registered, please reload this homepage for the map display.
Note
Home card can be used to map a particular project that the user would like to see displayed on the home page. It can also be used as input to the different cartographic projects published. This requires the use of a data source that contains the URL of the projects.
Add data
Two solutions are proposed to charge GIS data on the installation server for your instance MapMint.
If you want to add light vector data ( <2MB ), go to the Data Management Module and use the data load utility (upload), whose operation is described in the section on Data Management Module.
If you want to load vector data or remain larger, you should use FTP access that was provided with the connection information to your instance MapMint. To do this, install and run a FTP client on your computer (such as FileZilla for example) and provide the following information in the form provided for this purpose (the top of the software window in the case of FileZilla) and click the “Login” button.
Parameter |
Definition |
Host |
URL or IP address of the server where your instance is installed |
Username |
Username provided by email |
Password |
Password provided by email |
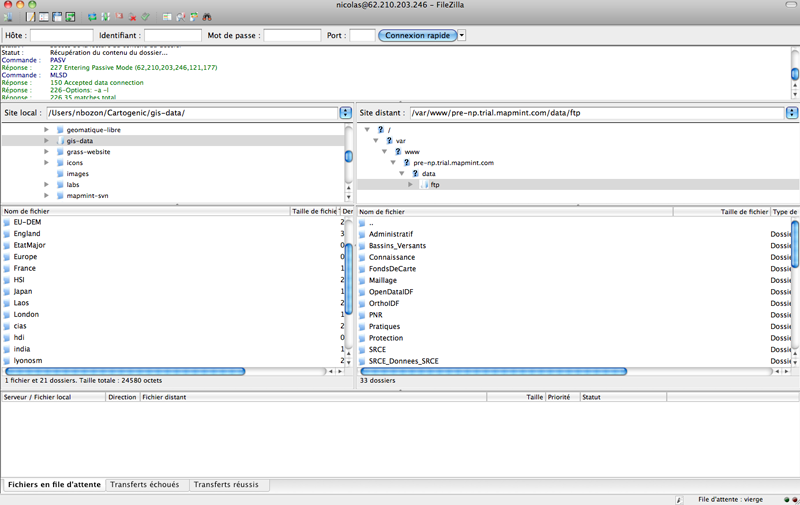
Once connected to the server, the general repository for storing data sources (this is usually live in the /var/www/data/ftp) is listed and displayed in the FTP client the right window. You can then create a new folder or use an existing directory.
In case you wish to add data to an existing directory, please perform drag and drop your data from the left side of the window (where the tree of your computer is listed) to the right, towards the directory referred. This causes the loading of data into the appropriate directory on the server. The progress of the file download is indicated by the progress bar at the bottom of the window. The transfer time varies depending on the weight of the data to be loaded.
In case you want to create a new folder, perform a right-click in the right pane and click the menu item “Create New Folder” from the popup menu that appears. Then enter a name for the new folder in the window provided for this purpose, then click the “OK” button. This will close the window and add the new directory to the list. You can then perform a drag and drop of your data as described in the preceding paragraph.
Warning
The name of a new data directory should not contain accents or special characters!
Access to data and processes from the desktop clients
As stated in the section Overview, MapMint provided web services for accessing data (WMS, WFS and WCS) and data processing services (WPS) for desktop clients, such as QGIS.
We present in this section how to access them from QGIS data broadcasting services and data processing services. We will present successively as how to use them.
Accessing data broadcasting services
MapMint makes accessible all the storage spaces and sources of data that is printed once in the last parameters from the Map creation module. Similarly, all the layers contained in the dynamic mapping applications configured for the Map creation module and published since the Application Publishing Module are also available.
Since QGIS for example, you can access the data layers in WMS format to keep the style you have defined at the Map creation module, or format WFS, to use the data processing services vector.
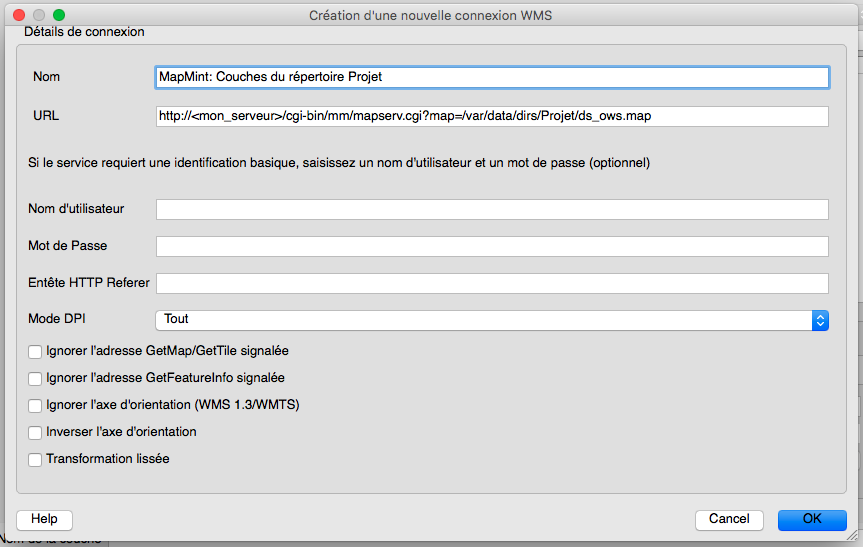
The URL to use to set the access to WMS and WFS server are:
for storage space <MyDirectory>:
http://votre-instance.com/cgi-bin/mm/mapserver.cgi?map=/var/data/dirs/<MyDirectory>/ds_ows.mapfor a project <MyProject> during setup:
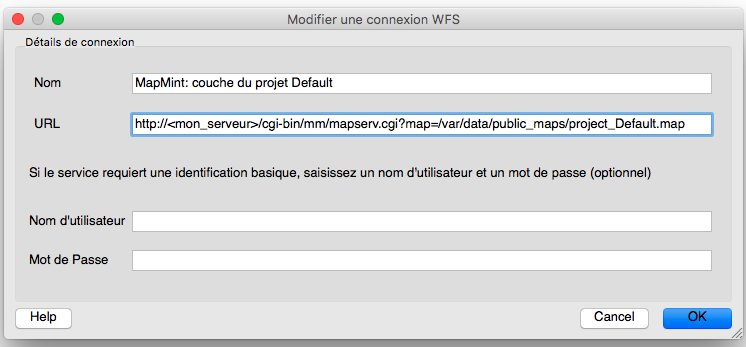
http://votre-instance.com/cgi-bin/mm/mapserver.cgi?map=/var/data/maps/project_<MyProject>.mapfor a <MyProject> published project:
http://votre-instance.com/cgi-bin/mm/mapserver.cgi?map=/var/data/public_maps/project_<MyProject>.map
Note
il est nécessaire de remplacer <MyProject> par le nom d’un projet et <MyDirectory> par le nom d’un espace de stockage disponible dans Data Management Module.
The two screenshots below shows the addition of WMS and WFS server.
 |
 |
Once you have added servers, then you can add layers in them. To do this, select vore server from the list of available servers, and then click Connection to list the available layers. Then select all the layers you want to display in your QGIS client.
Access to data processing services
Since QGIS for example, you can access the vector data processing services. To do this it is necessary to add the following server http://geolabs.fr/plugins.xml your plugins DEPOS in QGIS, then install the module QgsWPSClient. Once this is done then you should enable this new extension, then add a WPS server (as was presented in the previous section for WMS and WFS service). Adding this fact via the interface shown in the screenshot below.
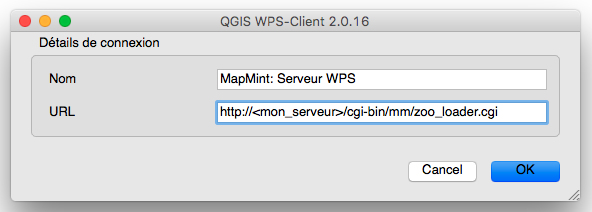
The URL to access treatment services is:
http://votre-instance.com/cgi-bin/mm/zoo_loader.cgi
Once added the WPS server, select it in the list and click Connect to list the esemble of available treatment services as shown below.
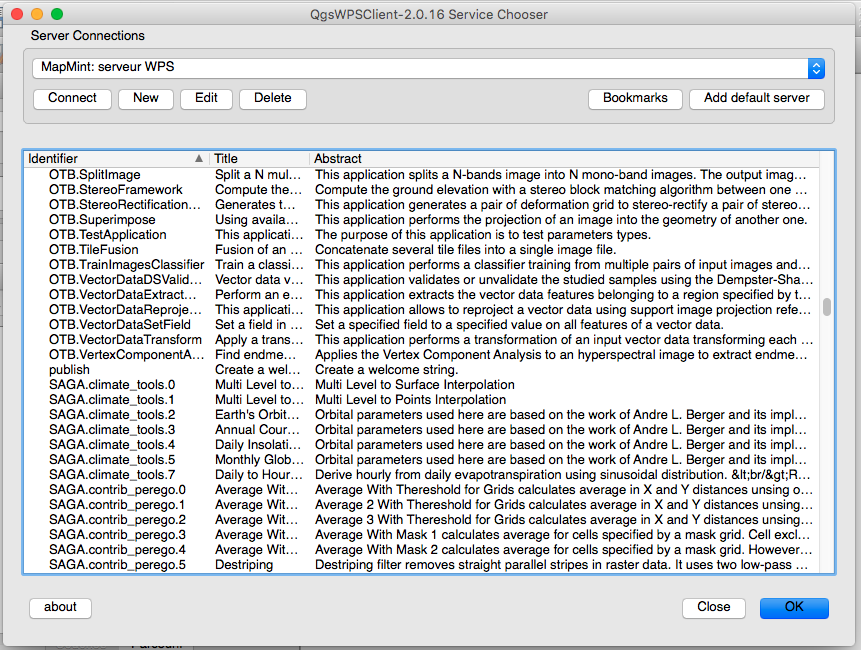
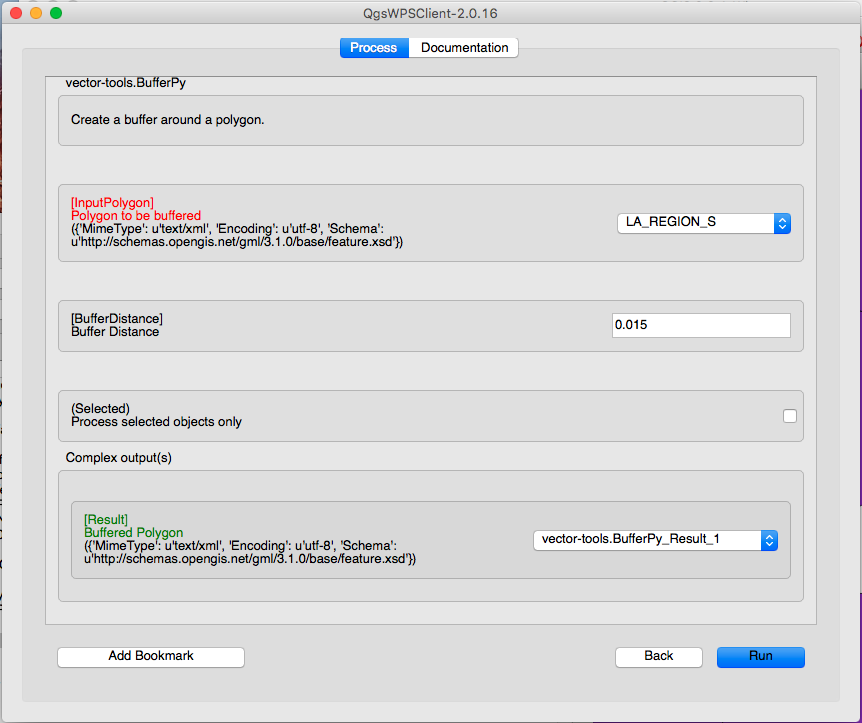
You must select a service was run by double-clicking on the service that interests you to access the through interface parameters WPS service. This interface corresponds to the following screenshot.
Warning
Only WFS and WCS layers can be used with WPS treatment services.
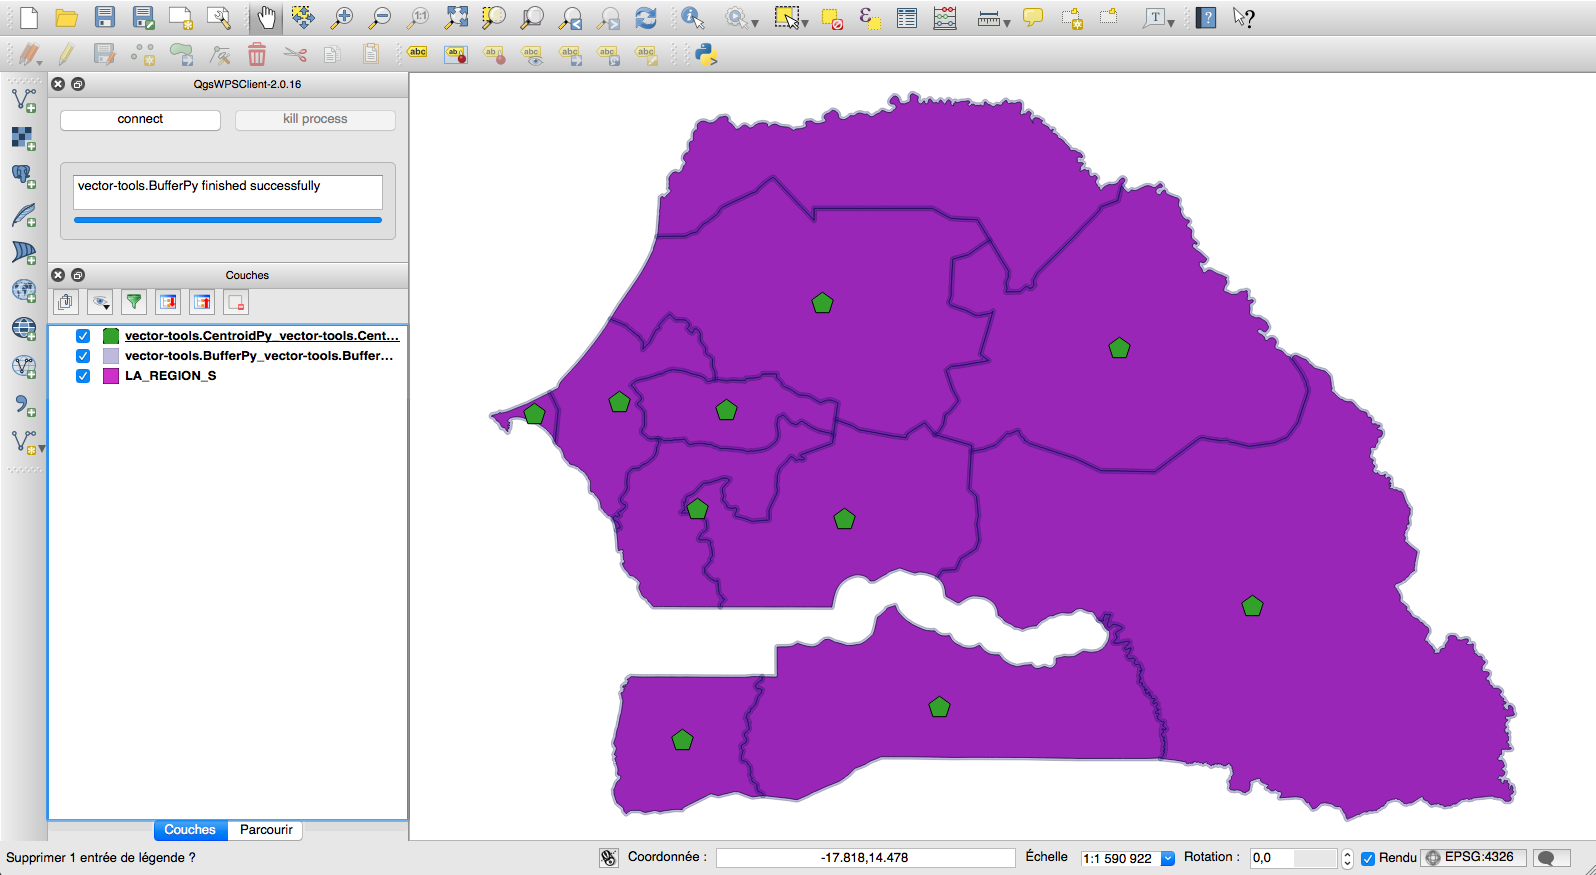
To perform and display the result, you must click on the button Run.
We present below below an example of using a vector layer LA_REGION_S and execution services vector-tools.BufferPy et vector-tools.CentroidPy.
 ..
..